RESULTS OF OPERATIONS
Goldman Sachs is a global investment banking and securities firm that
provides a wide range of services worldwide to a substantial and diversified
client base.
Our activities are divided into three principal business lines:
- Investment Banking, which includes financial advisory services and
underwriting;
- Trading and Principal Investments, which includes fixed income, currency
and commodities ("FICC"), equities and principal investments (principal
investments reflect primarily our investments in our merchant banking
funds); and
- Asset Management and Securities Services, which includes asset
management, securities services and commissions.
When we use the terms "Goldman Sachs", "we" and "our", we mean, prior
to the principal incorporation transactions that are described under "Certain
Relationships and Related Transactions — Incorporation and Related
Transactions — Incorporation Transactions", The Goldman Sachs Group, L.P., a
Delaware limited partnership, and its consolidated subsidiaries and, after the
incorporation transactions, The Goldman Sachs Group, Inc., a Delaware
corporation, and its consolidated subsidiaries.
Economic and market conditions can significantly affect our
performance. For a number of years leading up to the second half of 1998, we
operated in a generally favorable macroeconomic environment characterized by low
inflation, low interest rates and strong equity markets in the United States and
many international markets. This favorable economic environment provided a
positive climate for our investment banking activities, as well as for our
customer-driven and proprietary trading activities. Economic conditions were
also favorable for wealth creation which contributed positively to growth in our
asset management businesses.
From mid-August to mid-October 1998, the Russian economic crisis, the
turmoil in Asian and Latin American emerging markets and the resulting move to
higher credit quality fixed income securities by many investors led to
substantial declines in global financial markets. Investors broadly sold
credit-sensitive products, such as corporate and high-yield debt, and bought
higher-rated instruments, such as U.S. Treasury securities, which caused credit
spreads to widen dramatically. This market turmoil also caused a widespread
decline in global equity markets.
As a major dealer in fixed income securities, Goldman Sachs maintains
substantial inventories of corporate and high-yield debt. Goldman Sachs
regularly seeks to hedge the interest rate risk on these positions through,
among other strategies, short positions in U.S. Treasury securities. In the
second half of 1998, we suffered losses from both the decline in the prices of
corporate and high-yield debt instruments that we owned and the increase in the prices of the U.S.
Treasury securities in which we had short positions.
This market turmoil also led to trading losses in our fixed income
relative value trading positions. Relative value trading positions are intended
to profit from a perceived temporary dislocation in the relationship between the
values of different financial instruments. From mid-August to mid-October 1998,
the components of these relative value positions moved in directions that we did
not anticipate and the volatilities of some of our positions increased to three
times prior levels. When Goldman Sachs and other market participants with
similar positions simultaneously sought to reduce positions and exposures, this
caused a substantial reduction in market liquidity and a continuing decline in
prices.
In the second half of 1998, we also experienced losses in equity
arbitrage and in the value of a number of merchant banking investments.
Later in the fourth quarter of 1998, market conditions improved as the
U.S. Federal Reserve cut interest rates, the International Monetary Fund
finalized a credit agreement with Brazil and a consortium of 14 financial
institutions, including Goldman Sachs, recapitalized Long-Term Capital
Portfolio, L.P. For a further discussion of Long-Term Capital Portfolio, L.P.,
see "— Liquidity — The Balance Sheet" below.
Our earnings in the second half of 1998 were adversely affected by
market conditions from mid-August to mid-October. In this difficult business
environment, Trading and Principal Investments recorded net revenues of $464
million in the third quarter of 1998 and net revenues of negative $663 million
in the fourth quarter of 1998. As a result, Trading and Principal Investments
did not make a significant contribution to pre-tax earnings in 1998.
In the first quarter of 1999, we operated in a generally favorable
macroeconomic environment characterized by low inflation and low interest rates.
Global financial markets recovered from the turbulent conditions of the second
half of 1998, leading to narrowing credit spreads and an increase in mergers and
acquisitions and other corporate activity.
The macroeconomic environment in the first quarter of 1999 was
particularly favorable in the United States, where inflationary pressures were
minimal and interest rates were left unchanged by the U.S. Federal Reserve.
Economic growth in Europe was sluggish despite a simultaneous cut in interest
rates by 11 European central banks in December and the successful establishment
of the European Economic and Monetary Union in January. Markets in Asia and
Latin America were generally characterized by continuing economic and financial
difficulties, particularly in Japan and Brazil. In a number of Asian emerging
markets, however, economic and market conditions stabilized in the first quarter
of 1999.
Management believes that the best measure by which to assess Goldman
Sachs' historical profitability is pre-tax earnings because, as a partnership,
we generally have not been subject to U.S. federal or state income taxes. See
"— Provision for Taxes" below and Note 2 to the audited consolidated
financial statements for a further discussion of our provision for taxes.
Since historically we have operated as a partnership, payments to our
profit participating limited partners have been accounted for as distributions
of partners' capital rather than as compensation expense. As a result, our
compensation and benefits expense has not reflected any payments for services
rendered by managing directors who were profit participating limited partners
and has therefore understated the expected operating costs to be incurred by us
after the offerings. As a
corporation, we will include these payments to managing directors who were
profit participating limited partners in compensation and benefits expense, as
discussed under "Pro Forma Consolidated Financial Information". See
"Management — The Partner Compensation Plan" for a further discussion of the
plan to be adopted for the purpose of compensating our managing directors who
were profit participating limited partners.
Moreover, in connection with the offerings, we will record the effect
of the following non-recurring items in the second quarter of 1999:
- the award of the restricted stock units to employees based on a
formula;
- the initial irrevocable contribution of shares of common stock to the
defined contribution plan;
- the recognition of net tax assets; and
- the contribution to the Goldman Sachs Fund, a charitable foundation.
We also expect to record additional expense in the second quarter of 1999
equal to (i) 50% of the estimated compensation and benefits of the managing
directors who were profit participating limited partners in 1999 based on the
annualized results for the first half of 1999 offset by (ii) the effect of
issuing restricted stock units to employees, in lieu of cash compensation, for
which future service is required as a condition to the delivery of the
underlying shares of common stock. In accordance with Accounting Principles
Board Opinion No. 25, these restricted stock units will be recorded as
compensation expense over the four-year vesting period following the date of
grant.
As a result, we expect to record a substantial pre-tax loss in the
second quarter of 1999. See "Risk Factors — We Expect to Record a Substantial
Pre-Tax Loss in the Second Quarter of Fiscal 1999".
The composition of our historical net revenues has varied over time as
financial markets and the scope of our operations have changed. The composition
of net revenues can also vary over the shorter term due to fluctuations in
economic and market conditions. As a result, period-to-period comparisons may
not be meaningful. See "Risk Factors" for a discussion of factors that could
affect our future performance.
Overview
The following table sets forth our net revenues and pre-tax
earnings:
(in millions)
| Year Ended November |
Three Months Ended February |
||||
|---|---|---|---|---|---|
| 1996 |
1997 |
1998 |
1998 |
1999 |
|
| (unaudited) | |||||
| Net revenues | $6,129 | $7,447 | $8,520 | $2,472 | $2,995 |
| Pre-tax earnings | 2,606 | 3,014 | 2,921 | 1,022 | 1,188 |
February 1999 versus February 1998. Our net revenues were $2.99
billion in the three-month period ended February 1999, an increase of 21%
compared to the same period in 1998. Net revenue growth was strong in Investment
Banking, which increased 42%,
primarily due to higher market levels of mergers and acquisitions and
underwriting activity. Net revenues in Trading and Principal Investments
increased 15% as higher net revenues in FICC and equities more than offset a
reduction in principal investments. Net revenues in Asset Management and
Securities Services increased 12% due to increased assets under management and
higher customer balances in securities services. Pre-tax earnings increased 16%
to $1.19 billion for the period.
1998 versus 1997. Our net revenues were $8.52 billion in 1998,
an increase of 14% compared to 1997. Net revenue growth was strong in Investment
Banking, which increased 30%, due to higher levels of mergers and acquisitions
activity, and in Asset Management and Securities Services, which increased 43%,
due to increased commissions, higher customer balances in securities services
and increased assets under management. Net revenues in Trading and Principal
Investments decreased 19% compared to the prior year, due primarily to a 30%
reduction of net revenues in FICC. Pre-tax earnings in 1998 were $2.92 billion
compared to $3.01 billion in the prior year.
1997 versus 1996. Our net revenues were $7.45 billion in 1997,
an increase of 22% compared to 1996. Net revenue growth was strong in Asset
Management and Securities Services, which increased 46%, due to increased
commissions and asset management fees and higher assets under management and
customer balances in securities services. Net revenues in Investment Banking
increased 22% due to increased levels of mergers and acquisitions and debt
underwriting activity. Net revenues in Trading and Principal Investments
increased 9% over the prior year, due to higher net revenues in FICC and
principal investments. Pre-tax earnings were $3.01 billion in 1997, an increase
of 16% over the prior year.
The following table sets forth the net revenues of our principal
business lines:
| Year Ended November |
Three Months Ended February |
||||
|---|---|---|---|---|---|
| 1996 |
1997 |
1998 |
1998 |
1999 |
|
| (unaudited) | |||||
| Investment Banking | $2,113 | $2,587 | $3,368 | $ 633 | $ 902 |
| Trading and Principal Investments | 2,693 | 2,926 | 2,379 | 1,182 | 1,357 |
| Asset Management and Securities Services | 1,323 |
1,934 |
2,773 |
657 |
736 |
| Total net revenues | $6,129 |
$7,447 |
$8,520 |
$2,472 |
$2,995 |
Net revenues in our principal business lines represent total revenues
less allocations of interest expense to specific securities, commodities and
other positions in relation to the level of financing incurred by each position.
Interest expense is allocated to Trading and Principal Investments and the
securities services component of Asset Management and Securities Services. Net
revenues may not be indicative of the relative profitability of any principal
business line.
Investment Banking
Goldman Sachs provides a broad range of investment banking services to
a diverse group of corporations, financial institutions, governments and
individuals. Our investment banking activities are divided into two
categories:
- Financial Advisory. Financial advisory includes advisory
assignments with respect to mergers and acquisitions, divestitures,
corporate defense activities, restructurings and spin-offs; and
- Underwriting. Underwriting includes public offerings and private placements of equity and debt securities.
The following table sets forth the net revenues of our Investment
Banking business:
(in millions)
| Year Ended November
|
Three Months Ended February |
||||
|---|---|---|---|---|---|
| 1996 |
1997 |
1998 |
1998 |
1999 |
|
| (unaudited) | |||||
| Financial advisory | $ 931 | $1,184 | $1,774 | $363 | $522 |
| Underwriting | 1,182 |
1,403 |
1,594 |
270 |
380 |
| Total Investment Banking | $2,113 |
$2,587 |
$3,368 |
$633 |
$902 |
February 1999 versus February 1998. The Investment Banking business
achieved net revenues of $902 million in the three-month period ended February
1999, an increase of 42% compared to the same period in 1998. Net revenue growth
was strong in both financial advisory and underwriting, particularly in the
communications, media and entertainment, healthcare and financial institutions
groups. Our Investment Banking business was particularly strong in Europe and
the United States.
Financial advisory revenues increased 44% compared to the same period
in 1998, primarily due to higher market levels of mergers and acquisitions
activity as the trend toward consolidation continued in various industries.
Underwriting revenues increased 41%, primarily due to increased levels of equity
underwriting activity in Europe.
1998 versus 1997. The Investment Banking business achieved net
revenues of $3.37 billion in 1998, an increase of 30% compared to 1997. Net
revenue growth was strong in financial advisory and, to a lesser extent, in
underwriting as Goldman Sachs' global presence and strong client base enabled it
to capitalize on higher levels of activity in many industry groups, including
communications, media and entertainment, financial institutions, general
industrials and retail. Net revenue growth in our Investment Banking business
was strong in all major regions in 1998 compared to the prior year.
Financial advisory revenues increased 50% compared to 1997 due to
increased revenues from mergers and acquisitions advisory assignments, which
principally resulted from consolidation within various industries
and generally favorable U.S. and European stock markets. Despite a substantial
decrease in the number of industry-wide underwriting transactions in August and
September of 1998, underwriting revenues increased 14% for the year, primarily
due to increased revenues from equity and high-yield corporate debt underwriting
activities.
1997 versus 1996. The Investment Banking business achieved net
revenues of $2.59 billion in 1997, an increase of 22% compared to 1996. Net
revenue growth was strong in both financial advisory and underwriting,
particularly in the financial institutions, general industrials and real estate
groups.
Financial advisory revenues increased 27% compared to 1996 primarily
due to increased revenues from mergers and acquisitions activity in the market
as a whole. Underwriting revenues increased 19% primarily due to increased
revenues from investment grade and high-yield debt underwriting, which resulted
from lower interest rates. Revenues from equity underwriting activities
increased modestly over 1996 levels.
Trading and Principal Investments
Our Trading and Principal Investments business facilitates customer
transactions and takes proprietary positions through market-making in and
trading of fixed income and equity products, currencies, commodities, and swaps
and other derivatives. The Trading and Principal Investments business includes
the following:
- FICC. We make markets in and trade fixed income products, currencies and commodities, structure and enter into a wide variety of derivative transactions and engage in proprietary trading and arbitrage activities;
- Equities. We make markets in and trade equities and equity-related products, structure and enter into equity derivative transactions and engage in proprietary trading and equity arbitrage; and
- Principal Investments. Principal investments primarily represents net revenues from our investments in our merchant banking funds.
Net revenues from principal investments do not include management fees
and the increased share of the income and gains from our merchant banking funds
to which Goldman Sachs is entitled when the return on investments exceeds
certain threshold returns to fund investors. These management fees and increased
shares of income and gains are included in the net revenues of Asset Management
and Securities Services.
Substantially all of our inventory is marked-to-market daily and,
therefore, its value and our net revenues are subject to fluctuations based on
market movements. In addition, net revenues derived from our principal
investments in privately held concerns and in real estate may fluctuate
significantly depending on the revaluation or sale of these investments in any
given period.
The following table sets forth the net revenues of our Trading and
Principal Investments business:
| Year Ended November |
Three Months Ended February |
||||
|---|---|---|---|---|---|
| 1996 |
1997 |
1998 |
1998 |
1999 |
|
| (unaudited) | |||||
| FICC | $1,749 | $2,055 | $1,438 | $ 741 | $ 876 |
| Equities | 730 | 573 | 795 | 365 | 455 |
| Principal investments | 214 |
298 |
146 |
76 |
26 |
| Total Trading and Principal Investments | $2,693 |
$2,926 |
$2,379 |
$1,182 |
$1,357 |
February 1999 versus February 1998.The Trading and Principal
Investments business achieved net revenues of $1.36 billion in the three-month
period ended February 1999, an increase of 15% compared to the same period in
1998. Strong performances in FICC and equities more than offset a net revenue
reduction in principal investments.
Net revenues in FICC increased 18% compared to the same period in 1998,
primarily due to higher net revenues from market-making and trading of
currencies, corporate bonds and mortgage-backed securities, partially offset by
lower net revenues from fixed income derivatives.
Net revenues in equities increased 25% compared to the same period in
1998, primarily due to increased market-making net revenues resulting from
strong over-the-counter transaction volume in Europe and the United States.
Net revenues from principal investments decreased 66%, due to lower
gains on the disposition of investments and a reduction in net revenues related
to the mark-to-market of our principal investments.
1998 versus 1997. Net revenues in Trading and Principal
Investments were $2.38 billion in 1998, a decrease of 19% compared to 1997. This
decrease in net revenues was concentrated in the second half of the year. See
"— Business Environment" above for a discussion of the losses suffered in
Trading and Principal Investments in the second half of 1998. For the full year,
significant net revenue reductions in FICC and principal investments were
partially offset by increased net revenues in equities.
Net revenues in FICC decreased 30% compared to 1997 due to an
extraordinarily difficult environment in the second half of 1998. The net
revenue reduction in FICC was concentrated in fixed income arbitrage and
high-yield debt trading, which experienced losses in 1998 due to a reduction in
liquidity and widening credit spreads in the second half of the year. An
increase in net revenues from market-making and trading in fixed income
derivatives, currencies and commodities partially offset this decline.
Net revenues in equities increased 39% compared to 1997 as higher net
revenues in derivatives and European shares were partially offset by losses in
equity arbitrage. The derivatives business generated significantly higher net
revenues due, in part, to strong customer demand for over-the-counter products,
particularly in Europe. Net revenues from European shares increased as Goldman
Sachs benefited from generally favorable equity markets and increased customer
demand. The equity arbitrage losses were due principally to the underperformance
of various equity positions versus their benchmark hedges, to widening of
spreads in a variety of relative value trades and to lower prices for
event-oriented securities resulting from a reduction in announced mergers and
acquisitions and other corporate activity in the second half of 1998.
Net revenues from principal investments declined 51% compared to 1997
as investments in certain publicly held companies decreased in value during the
second half of 1998. This decrease was partially offset by an increase in gains
on the disposition of investments compared to the prior year.
1997 versus 1996. The Trading and Principal Investments business
achieved net revenues of $2.93 billion in 1997, an increase of 9% compared to
1996. Strong performances in FICC and principal investments more than offset a
net revenue reduction in equities.
Net revenues in FICC increased 17% compared to 1996 due principally to
higher net revenues from market-making and trading in currencies, fixed income
derivatives and commodities. Fixed income arbitrage activities also contributed
to net revenue growth in FICC. Net revenues from market-making in and trading of
emerging market debt securities and corporate bonds declined in 1997 compared to
1996.
Net revenues in equities decreased 22% in 1997 compared to 1996 due
principally to reductions in net revenues from derivatives and convertibles
resulting from volatility in the global equity markets in October and November
1997 and declining asset values in Japan in late November 1997. This reduction
was partially offset by increased net revenues from higher customer trading
volume in certain European over-the-counter markets.
Net revenues from principal investments increased 39% in 1997 compared
to 1996, as certain companies in which we invested through our merchant banking
funds completed initial public offerings and our positions in other publicly
held companies increased in value.
Asset Management and Securities Services
Asset Management and Securities Services is comprised of the
following:
- Asset Management. Asset management generates management fees by
providing investment advisory services to a diverse and rapidly growing
client base of institutions and individuals;
- Securities Services. Securities services includes prime
brokerage, financing services and securities lending and our matched
book businesses, all of which generate revenue primarily in the form of
fees or interest rate spreads; and
- Commissions. Commission-based businesses include agency transactions for clients on major stock and futures exchanges. Revenues from the increased share of the income and gains derived from our merchant banking funds are also included in commissions.
The following table sets forth the net revenues of our Asset Management
and Securities Services business:
| Year Ended November |
Three Months Ended February |
||||
|---|---|---|---|---|---|
| 1996 |
1997 |
1998 |
1998 |
1999 |
|
| (unaudited) | |||||
| Asset management | $ 242 | $ 458 | $ 675 | $139 | $202 |
| Securities services | 354 | 487 | 730 | 170 | 207 |
| Commissions | 727 |
989 |
1,368 |
348 |
327 |
| Total Asset Management and Securities Services | $1,323 |
$1,934 |
$2,773 |
$657 |
$736 |
Goldman Sachs' assets under supervision are comprised of assets under
management and other client assets. Assets under management typically generate
fees based on a percentage of their value and include our mutual funds, separate
accounts managed for institutional and individual investors, our merchant
banking funds and other alternative investment funds. Other client assets are
comprised of assets in brokerage accounts of primarily high net worth
individuals, on which we earn commissions. The following table sets forth our
assets under supervision:
| Three Months Ended | |||||
|---|---|---|---|---|---|
| Year Ended November |
February |
||||
| 1996 |
1997 |
1998 |
1998 |
1999 |
|
| (unaudited) | |||||
| Assets under management | $ 94,599 | $135,929 | $194,821 | $151,189 | $206,380 |
| Other client assets | 76,892 |
102,033 |
142,018 |
114,928 |
163,315 |
| Total assets under supervision | $171,491 |
$237,962 |
$336,839 |
$266,117 |
$369,695 |
February 1999 versus February 1998. The Asset Management and
Securities Services business achieved net revenues of $736 million in the
three-month period ended February 1999, an increase of 12% compared to
the same period in 1998. Strong performances in asset management and securities
services more than offset a net revenue reduction in commissions.
Asset management revenues increased 45% compared to the same period in
1998, primarily reflecting a 43% increase in average assets under management. In
the 1999 period, approximately half of the increase in assets under management
was attributable to net asset inflows, with the balance reflecting market
appreciation. Net revenues from securities services increased 22% during the
period, primarily due to growth in our securities borrowing and lending
businesses. Commission revenues decreased 6%, as an increase in equity
commissions was more than offset by a reduction in revenues from the increased
share of income and gains from our merchant banking funds compared to a
particularly strong period in the prior year.
1998 versus 1997. The Asset Management and Securities Services
business achieved net revenues of $2.77 billion in 1998, an increase of 43%
compared to 1997. All major components of the business line exhibited strong net
revenue growth.
Asset management revenues increased 47% during this period, reflecting
a 41% increase in average assets under management over 1997. In 1998,
approximately 80% of the increase in assets under management was attributable to
net asset inflows, with the remaining 20% reflecting market appreciation. Net
revenues from securities services increased 50%, primarily due to growth in our
securities borrowing and lending businesses. Commission revenues increased 38%
as generally strong and highly volatile equity markets resulted in increased
transaction volumes in listed equity securities. Revenues from the increased
share of income and gains from our merchant banking funds also contributed
significantly to the increase in commission revenues.
1997 versus 1996. The Asset Management and Securities Services
business achieved net revenues of $1.93 billion in 1997, an increase of 46%
compared to 1996. All major components of the business line exhibited strong net
revenue growth.
Asset management revenues increased 89% during this period, reflecting
a 73% increase in average assets under management due to strong net asset
inflows, market appreciation and assets added through the acquisitions of
Liberty Investment Management in January 1997 and Commodities Corporation in
June 1997. Net revenue growth in securities services was 38%, principally
reflecting growth in our securities borrowing and lending businesses. Commission
revenues increased 36% as customer trading volumes increased significantly on
many of the world's principal stock exchanges, including those in the United
States where industry-wide volumes increased substantially in the third and
fourth quarters of 1997. Revenues from the increased share of income and gains
from our merchant banking funds also contributed significantly to the increase
in commission revenues.
Operating Expenses
In recent years, our operating expenses have increased as a result of
numerous factors, including higher levels of compensation, expansion of our
asset management business, increased worldwide activities, greater levels of
business complexity and additional systems and consulting costs relating to
various technology initiatives.
Since we have historically operated in partnership form, payments to
our profit participating limited partners have been accounted for as
distributions of partners' capital rather than as compensation expense. As a
result, our compensation and benefits expense has not reflected any payments for
services rendered by our managing directors who were profit participating
limited partners. Accordingly, our historical compensation and benefits, the
principal component of our operating expenses, will increase significantly after
the offerings since, as a corporation, we will
include these payments to our managing directors who were profit participating
limited partners in compensation and benefits expense.
We expect to record additional expense in the second quarter of 1999
equal to (i) 50% of the estimated compensation and benefits of the managing
directors who were profit participating limited partners in 1999 based on the
annualized results for the first half of 1999 offset by (ii) the effect of
issuing restricted stock units to employees, in lieu of cash compensation, for
which future service is required as a condition to the delivery of the
underlying shares of common stock. In accordance with Accounting Principles
Board Opinion No. 25, these restricted stock units will be recorded as
compensation expense over the four-year vesting period following the date of
grant. In addition, we expect to record non-cash compensation expense related to
the amortization of the restricted stock units awarded to employees on a
discretionary basis over the five-year period following the consummation of the
offerings. The non-cash expense related to these restricted stock units is a
fixed amount that is not dependent on our operating results in any given period.
See "Pro Forma Consolidated Financial Information" for a further discussion of
these items.
The following table sets forth our operating expenses and number of
employees:
| Year Ended November |
Three Months Ended February |
||||
|---|---|---|---|---|---|
| 1996 |
1997 |
1998 |
1998 |
1999 |
|
| (unaudited) | |||||
| Compensation and benefits | $2,421 | $ 3,097 | $ 3,838 | $ 1,100 | $ 1,275 |
| Brokerage, clearing and exchange fees | 278 | 357 | 424 | 93 | 111 |
| Market development | 137 | 206 | 287 | 54 | 77 |
| Communications and technology | 173 | 208 | 265 | 58 | 78 |
| Depreciation and amortization | 172 | 178 | 242 | 42 | 97 |
| Occupancy | 154 | 168 | 207 | 44 | 78 |
| Professional services and other | 188 |
219 |
336 |
59 |
91 |
| Total operating expenses | $3,523 |
$ 4,433 |
$ 5,599 |
$ 1,450 |
$ 1,807 |
| Employees at period end(1) | 8,977 | 10,622 | 13,033 | 10,899 | 12,878 |
(1) Excludes employees of Goldman Sachs' two property management
subsidiaries, The Archon Group, L.P. and Archon Group (France)
S.C.A. Substantially all of the costs of these employees are
reimbursed to Goldman Sachs by the real estate investment funds
to which the two companies provide property management services.
In addition, as of February 1999, we had approximately 3,400
temporary staff and consultants. For more detailed information
regarding our employees, see "Business — Employees".
February 1999 versus February 1998. Operating expenses were $1.81
billion in the three-month period ended February 1999, an increase of 25% over
the same period in 1998, primarily due to increased compensation and benefits
and higher other operating expenses due to, among other things, Goldman Sachs'
increased worldwide activities.
Compensation and benefits decreased as a percentage of net revenues to
43% from 44% in the same period in 1998. Employment levels increased 18%
compared to the same period in 1998, with particularly strong growth in
investment banking and asset management. Expenses associated with our temporary
staff and consultants were $98 million for the three-month period ended February
1999, an increase of 55%, reflecting preparations for the Year 2000 and greater
levels of business activity.
Brokerage, clearing and exchange fees increased 19%, primarily due to
higher transaction volumes in fixed income derivatives and futures contracts.
Market development expenses increased 43% and professional services and other
expenses increased 54%, due to higher levels of business activity.
Communications and technology expenses increased 34%, reflecting higher
telecommunications and market data costs associated with higher employment
levels and additional spending on technology initiatives. Depreciation and
amortization increased significantly due to certain fixed asset write-offs and
to capital expenditures on telecommunications and technology-related equipment
and leasehold improvements in support of Goldman Sachs' increased worldwide
activities. Occupancy expenses increased 77%, reflecting additional office space
needed to accommodate higher employment levels.
1998 versus 1997. Operating expenses were $5.60 billion in 1998,
an increase of 26% over 1997, primarily due to increased compensation and
benefits expense.
Compensation and benefits increased as a percentage of net revenues to
45% from 42% in 1997, principally as a result of increases in employment levels
and in expenses associated with temporary staff and consultants. Employment
levels increased 23% during the year, with particularly strong growth in asset
management. Expenses associated with our temporary staff and consultants were
$330 million in 1998, an increase of 85% compared to 1997, reflecting greater
business activity, Goldman Sachs' global expansion and consulting costs
associated with various technology initiatives, including preparations for the
Year 2000 and the establishment of the European Economic and Monetary Union.
Brokerage, clearing and exchange fees increased 19%, primarily due to
higher transaction volumes in European and U.S. equities and futures contracts.
Market development expenses increased 39% and professional services and other
expenses increased 53%, due to higher levels of business activity and Goldman
Sachs' global expansion. Communications and technology expenses increased 27%,
reflecting higher telecommunications and market data costs associated with
higher employment levels and additional spending on technology initiatives.
Depreciation and amortization increased 36%, principally due to capital
expenditures on telecommunications and technology-related equipment and
leasehold improvements. Occupancy expenses increased 23%, reflecting additional
office space needed to accommodate higher employment levels.
1997 versus 1996. Operating expenses were $4.43 billion in 1997,
an increase of 26% over 1996, primarily due to increased compensation and
benefits expense.
Compensation and benefits increased as a percentage of net revenues to
42% from 40% in 1996. This increase primarily reflected higher compensation due
to higher profit levels and an 18% increase in employment
levels across Goldman Sachs due to higher levels of market activity and our
global expansion into new businesses and markets. Expenses associated with our
temporary staff and consultants also contributed to the increase in compensation
and benefits as a percentage of net revenues. These expenses were $178 million
in 1997, an increase of 55% compared to 1996, reflecting greater business
activity, Goldman Sachs' global expansion and consulting costs associated with
various technology initiatives.
Brokerage, clearing and exchange fees increased 28%, primarily due to
higher transaction volumes in global equities, derivatives and currencies.
Market development expenses increased 50% and professional services and other
expenses increased 16%, due to higher levels of business activity and Goldman
Sachs' global expansion. Communications and technology expenses increased 20%,
reflecting higher telecommunications and market data costs associated with
higher employment levels and additional spending on technology initiatives.
Depreciation and amortization increased 3%. Occupancy expenses increased 9%,
reflecting additional office space needed to accommodate higher employment
levels.
Provision for Taxes
The Goldman Sachs Group, L.P., as a partnership, generally has not been
subject to U.S. federal and state income taxes. The earnings of The Goldman
Sachs Group, L.P. and certain of its subsidiaries have been subject to the 4%
New York City unincorporated business tax. In addition, certain of our non-U.S.
subsidiaries have been subject to income taxes in their local jurisdictions. The
amount of our provision for income and unincorporated business taxes has varied
significantly from year to year depending on the mix of earnings among our
subsidiaries. For information on the pro forma effective tax rate of Goldman
Sachs under corporate form, see "Pro Forma Consolidated Financial
Information".
Geographic Data
For a summary of the total revenues, net revenues, pre-tax earnings and
identifiable assets of Goldman Sachs by geographic region, see Note 9 to the
audited consolidated financial statements.
Our cash flows are primarily related to the operating and financing
activities undertaken in connection with our trading and market-making
transactions.
Year Ended November 1998
Cash and cash equivalents increased to $2.84 billion in 1998. Cash of
$62 million was provided by operating activities. Cash of $656 million was used
for investing activities, primarily for leasehold improvements and the purchase
of telecommunications and technology-related equipment and certain financial
instruments. Financing activities provided $2.10 billion of cash, reflecting an
increase in the net issuance of long-term and short-term borrowings, partially
offset by a decrease in net repurchase agreements, distributions to partners,
cash outflows related to partners' capital allocated for income taxes and
potential withdrawals and the termination of our profit participation plans. See
Note 8 to the audited consolidated financial statements for a discussion of the
termination of the profit participation plans.
Year Ended November 1997
Cash and cash equivalents decreased to $1.33 billion in 1997. Operating
activities provided cash of $70 million. Cash of $693 million was used for
investing activities, primarily for the purchase of certain financial
instruments and technology-related equipment. Cash of $258 million was used for
financing activities, principally due to a decrease in net repurchase
agreements, distributions to partners and cash outflows related to partners'
capital allocated for income taxes and potential withdrawals, partially offset
by the net issuance of long-term and short-term borrowings.
Year Ended November 1996
Cash and cash equivalents increased to $2.21 billion in 1996. Cash of
$14.63 billion was used for operating activities, primarily to fund higher net
trading assets due to increased levels of business activity. Cash of $218
million was used for investing activities, primarily for the purchase of
technology-related equipment and leasehold improvements. Financing activities
provided $16.10 billion of cash, reflecting an increase in net repurchase
agreements and the net issuance of long-term borrowings, partially offset by
distributions to partners and cash outflows related to partners' capital
allocated for income taxes and potential withdrawals.
Management Oversight of Liquidity
Management believes that one of the most important issues for a company
in the financial services sector is access to liquidity. Accordingly, Goldman
Sachs has established a comprehensive structure to oversee its liquidity and
funding policies.
The Finance Committee has responsibility for establishing and assuring
compliance with our asset and liability management policies and has oversight
responsibility for managing liquidity risk, the size and composition of our
balance sheet and our credit ratings. See "— Risk Management — Risk
Management Structure" below for a further description of the committees that
participate in our risk management process. The Finance Committee meets monthly,
and more often when necessary, to evaluate our liquidity position and funding
requirements.
Our Treasury Department manages the capital structure, funding,
liquidity and relationships with creditors and rating agencies on a global
basis. The Treasury Department works jointly with our global funding desk in
managing our borrowings. The global funding desk is primarily responsible for
our transactional short-term funding activity.
Liquidity Policies
In order to maintain an appropriate level of liquidity, management has
implemented several liquidity policies as outlined below.
Diversification of Funding Sources and Liquidity
Planning. Goldman Sachs maintains diversified funding sources with both
banks and non-bank lenders globally. Management believes that Goldman Sachs'
relationships with its lenders are critical to its liquidity. We maintain close
contact with our primary lenders to keep them advised of significant
developments that affect us.
Goldman Sachs also has access to diversified funding sources with over
800 creditors, including banks, insurance companies, mutual funds, bank trust
departments and other asset managers. We monitor our creditors to maintain broad
and diversified credit, and no single creditor represented more than 5% of our
uncollateralized funding sources as of November 1998. Uncollateralized funding
sources principally include our short-term and long-term borrowings and letters
of credit.
We access liquidity in a variety of markets in the United States as
well as in Europe and Asia. In addition, we make extensive use of the repurchase
agreement market and have raised debt in the private placement, the SEC's Rule
144A and the commercial paper markets, as well as through Eurobonds, money
broker loans, commodity-based
financings, letters of credit and promissory notes. After the offerings and
subject to market conditions, we intend to raise additional funds in the public
debt securities market, including through an anticipated $1 billion offering of
long-term debt securities and an anticipated �1 billion offering of long-term
debt securities payable in euros. We seek to structure our liabilities to avoid
significant amounts of debt coming due on any one day or during any single week
or year. In addition, we maintain and update annually a liquidity crisis plan
that provides guidance in the event of a liquidity crisis. The annual update of
this plan is reviewed and approved by our Finance Committee.
Asset Liquidity. Goldman Sachs maintains a highly liquid balance
sheet. Many of our assets are readily funded in the repurchase agreement
markets, which generally have proven to be a consistent source of funding, even
in periods of market stress. Substantially all of our inventory turns over
rapidly and is marked-to-market daily. We maintain long-term borrowings and
partners' capital substantially in excess of our less liquid assets.
Dynamic Liquidity Management. Goldman Sachs seeks to manage the
composition of its asset base and the maturity profile of its funding to ensure
that it can liquidate its assets prior to its liabilities coming due, even in
times of liquidity stress. We have traditionally been able to fund our liquidity
needs through collateralized funding, such as repurchase transactions and
securities lending, as well as short-term and long-term borrowings and partners'
capital. To further evaluate the adequacy of our liquidity management policies
and guidelines, we perform weekly "stress funding" simulations of disruptions to
our access to unsecured credit.
Excess Liquidity. In addition to maintaining a highly liquid
balance sheet and a significant portion of longer-term liabilities to assure
liquidity even during adverse conditions, we seek to maintain a liquidity
cushion that consists principally of unencumbered U.S. government and agency
obligations to ensure the availability of immediate liquidity. This pool of
highly liquid assets averaged $14.17 billion during 1998 and $12.54 billion
during 1997.
Liquidity Ratio Maintenance. It is Goldman Sachs' policy to
further manage its liquidity by maintaining a "liquidity ratio" of at least
100%. This ratio measures the relationship between the loan value of our
unencumbered assets and our short-term unsecured liabilities. The maintenance of
this liquidity ratio is intended to ensure that we could fund our positions on a
fully secured basis in the event that we were unable to replace our unsecured
debt maturing within one year. Under this policy, we seek to maintain
unencumbered assets in an amount that, if pledged or sold, would provide the
funds necessary to replace unsecured obligations that are scheduled to mature
(or where holders have the option to redeem) within the coming year.
Intercompany Funding. Most of the liquidity of Goldman Sachs is
raised by The Goldman Sachs Group, L.P., which then lends the necessary funds to
its subsidiaries and affiliates. We carefully manage our intercompany exposure
by generally requiring intercompany loans to have maturities equal to or shorter
than the maturities of the aggregate borrowings of The Goldman Sachs Group, L.P.
This policy ensures that the subsidiaries' obligations to The Goldman Sachs
Group, L.P. will generally mature in advance of The Goldman Sachs Group, L.P.'s
third-party long-term borrowings. In addition, many of the advances made to our
subsidiaries and affiliates are secured by marketable securities or other liquid
collateral. We generally fund our equity investments in subsidiaries with
partners' capital.
The Balance Sheet
Goldman Sachs maintains a highly liquid balance sheet that fluctuates
significantly between financial statement dates. In the fourth
quarter of 1998, we temporarily decreased our total assets to reduce risk and
increase liquidity in response to difficult conditions in the global financial
markets.
Our total assets were $230.62 billion as of February 1999 and $217.38
billion as of November 1998.
Our balance sheet size as of February 1999 and November 1998 increased
by $8.99 billion and $11.64 billion, respectively, due to the adoption of the
provisions of Statement of Financial Accounting Standards No. 125 that were
deferred by Statement of Financial Accounting Standards No. 127. For a
discussion of Statement of Financial Accounting Standards Nos. 125 and 127, see
"— Accounting Developments" below and Note 2 to the audited consolidated
financial statements.
As of February 1999 and November 1998, we held approximately $999
million and $1.04 billion, respectively, in high-yield debt securities and $1.39
billion and $1.49 billion, respectively, in bank loans, all of which are valued
on a mark-to-market basis. These assets may be relatively illiquid during times
of market stress. We seek to diversify our holdings of these assets by industry
and by geographic location.
As of February 1999 and November 1998, we held approximately $1.04
billion and $1.17 billion, respectively, of emerging market securities, and $103
million and $109 million, respectively, in emerging market loans, all of which
are valued on a mark-to-market basis. Of the $1.14 billion and $1.28 billion in
emerging market securities and loans, as of February 1999 and November 1998,
respectively, approximately $778 million and $968 million were sovereign
obligations, many of which are collateralized as to principal at stated
maturity.
In September 1998, a consortium of 14 banks and brokerage firms,
including Goldman Sachs, made an equity investment in Long-Term Capital
Portfolio, L.P., a major market participant. The objectives of this investment
were to provide sufficient capital to permit Long-Term Capital Portfolio, L.P.
to continue active management of its positions and, over time, to reduce risk
exposures and leverage, to return capital to the participants in the consortium
and ultimately to realize the potential value of the portfolio. We invested $300
million in Long-Term Capital Portfolio, L.P.
Credit Ratings
Goldman Sachs relies upon the debt capital markets to fund a
significant portion of its day-to-day operations. The cost and availability of
debt financing is influenced by our credit ratings. Credit ratings are also
important to us when competing in certain markets and when seeking to engage in
longer-term transactions, including over-the-counter derivatives. A reduction in
our credit ratings could increase our borrowing costs and limit our access to
the capital markets. This, in turn, could reduce our earnings and adversely
affect our liquidity.
The following table sets forth our credit ratings as of November
1998:
| Short-term debt |
Long-term debt |
|
|---|---|---|
| Moody's Investors Service, Inc | P-1 | A1 |
| Standard & Poor's Ratings Services(1) | A-1+ | A+ |
| Fitch IBCA, Inc . | F1+ | AA— |
| CBRS Inc . | A-1 (High) |
A+ |
(1) On September 25, 1998, Standard & Poor's Ratings
Services affirmed Goldman Sachs' credit ratings but
revised its outlook to "negative". On April 16, 1999,
Standard & Poor's Ratings Services revised its outlook
to "stable".
Long-Term Debt
As of November 1998, our consolidated long-term borrowings were $19.91
billion. Substantially all of these borrowings were unsecured and consisted
principally of senior borrowings with maturities extending to 2024. The weighted
average maturity of our long-term borrowings as of November 1998 was
approximately four years. Substantially all of our long-term borrowings are
swapped into U.S. dollar obligations with short-term floating rates of interest
in order to minimize our exposure to interest rates and foreign exchange
movements. See Note 5 to the audited consolidated financial statements for
further information regarding our long-term borrowings.
Many of our principal subsidiaries are subject to extensive regulation
in the United States and elsewhere. Goldman, Sachs & Co., a registered U.S.
broker-dealer, is regulated by the SEC, the Commodity Futures Trading
Commission, the Chicago Board of Trade, the NYSE and the NASD. Goldman Sachs
International, a registered United Kingdom broker-dealer, is subject to
regulation by the Securities and Futures Authority Limited and the Financial
Services Authority. Goldman Sachs (Japan) Ltd., a Tokyo-based broker-dealer, is
subject to regulation by the Japanese Ministry of Finance, the Financial
Supervisory Agency, the Tokyo Stock Exchange, the Tokyo International Financial
Futures Exchange and the Japan Securities Dealers Association. Several other
subsidiaries of Goldman Sachs are regulated by securities, investment advisory,
banking and other regulators and authorities around the world. Compliance with
the rules of these regulators may prevent us from receiving distributions,
advances or repayment of liabilities from these subsidiaries. See Note 8 to the
audited consolidated financial statements and Note 5 to the unaudited condensed
consolidated financial statements for further information regarding our
regulated subsidiaries.
Goldman Sachs has a comprehensive risk management process to monitor,
evaluate and manage the principal risks assumed in conducting its activities.
These risks include market, credit, liquidity, operational, legal and
reputational exposures.
Risk Management Structure
Goldman Sachs seeks to monitor and control its risk exposure through a
variety of separate but complementary financial, credit, operational and legal
reporting systems. We believe that we have effective procedures for evaluating
and managing the market, credit and other risks to which we are exposed.
Nonetheless, the effectiveness of our policies and procedures for managing risk
exposure can never be completely or accurately predicted or fully assured. For
example, unexpectedly large or rapid movements or disruptions in one or more
markets or other unforeseen developments can have a material adverse effect on
our results of operations and financial condition. The consequences of these
developments can include losses due to adverse changes in inventory values,
decreases in the liquidity of trading positions, higher volatility in our
earnings, increases in our credit risk to customers and counterparties and
increases in general systemic risk. See "Risk Factors — Market Fluctuations
Could Adversely Affect Our Businesses in Many
Ways" for a discussion of the effect that market fluctuations can have on our
businesses.
Goldman Sachs has established risk control procedures at several levels
throughout the organization. Trading desk managers have the first line of
responsibility for managing risk within prescribed limits. These managers have
in-depth knowledge of the primary sources of risk in their individual markets
and the instruments available to hedge our exposures. In addition, a number of
committees described in the following table are responsible for establishing
trading limits, monitoring adherence to these limits and for general oversight
of our risk management process.
| Committee |
Function |
| Management Committee | All risk control functions ultimately report to the Management Committee.
Through both direct and delegated authority, the Management Committee approves
all of Goldman Sachs':
|
|
|
|
| Risk Committees | The Firmwide Risk Committee:
The FICC Risk Committee sets market risk limits for individual business units and sets issuer-specific net inventory position limits. The Equities Risk Committee sets market risk limits for individual business units that consist of gross and net inventory position limits and, for equity derivatives, limits based on market move scenario analysis. The Asset Management Control Oversight Committee and Asset Management Risk Committee oversee various operational, credit, pricing and business practices issues. |
|
|
|
| Global Compliance and Control Committee | The Global Compliance and Control Committee provides oversight of our compliance and control functions, including internal audit, reviews our legal, reputational, operational and control risks, and periodically reviews the activities of existing businesses. |
|
|
|
| Commitments Committee | The Commitments Committee approves:
The Commitments Committee has delegated to the Credit Department the authority to approve underwriting commitments for investment grade debt and certain other products. |
|
|
|
| Credit Policy Committee | The Credit Policy Committee establishes and reviews broad credit policies and parameters that are implemented by the Credit Department. |
|
|
|
| Finance Committee | The Finance Committee is responsible for oversight of our capital, liquidity and funding needs and for setting certain inventory position limits. |
|
|
|
Segregation of duties and management oversight are fundamental elements
of our risk management process. Accordingly, departments that are independent of
the revenue producing units, such as the Firmwide Risk, Credit, Controllers,
Global Operations, Central Compliance, Management Controls and Legal
Departments, in part perform risk management functions, which include
monitoring, analyzing and evaluating risk.
Market Risk
The potential for changes in the market value of our trading positions
is referred to as "market risk". Our trading positions result from underwriting,
market-making and proprietary trading activities.
The broadly defined categories of market risk include exposures to
interest rates, currency rates, equity prices and commodity prices.
- Interest rate risks primarily result from exposures to changes in the
level, slope and curvature of the yield curve, the volatility of
interest rates, mortgage prepayment speeds and credit spreads.
- Currency rate risks result from exposures to changes in spot prices,
forward prices and volatilities of currency rates.
- Equity price risks result from exposures to changes in prices and
volatilities of individual equities, equity baskets and equity
indices.
- Commodity price risks result from exposures to changes in spot prices,
forward prices and volatilities of commodities, such as electricity,
natural gas, crude oil, petroleum products and precious and base
metals.
In addition to applying business judgment, senior management uses a
number of quantitative tools to manage our exposure to market risk. These tools
include:
- risk limits based on a summary measure of market risk exposure referred
to as Value-at-Risk or "VaR";
- risk limits based on a scenario analysis that measures the potential
effect of a significant widening of credit spreads on our trading net
revenues;
- inventory position limits for selected business units and country
exposures; and
- scenario analyses which measure the potential effect on our trading net
revenues of abnormal market movements.
VaR. VaR is the potential loss in value of Goldman Sachs'
trading positions due to adverse movements in markets over a defined time
horizon with a specified confidence level.
For the VaR numbers reported below, a one-day time horizon and a 95%
confidence level were used. This means that there is a one in 20 chance that
daily trading net revenues will fall below the expected daily trading net
revenues by an amount at least as large as the reported VaR. Thus, shortfalls
from expected trading net revenues on a single trading day greater than the
reported
VaR would be anticipated to occur, on average, about once a month. Shortfalls on
a single day can exceed reported VaR by significant amounts. Shortfalls can also
accumulate over a longer time horizon such as a number of consecutive trading
days. For a discussion of the limitations of our risk measures, see "Risk
Factors — Our Risk Management Policies and Procedures May Leave Us Exposed to
Unidentified or Unanticipated Risk".
The VaR numbers below are shown separately for interest rate, currency,
equity and commodity products, as well as for our overall trading positions.
These VaR numbers include the underlying product positions and related
hedges, which may include positions in other product areas. For example, the
hedge of a foreign exchange forward may include an interest rate futures
position and the hedge of a long corporate bond position may include a short
position in the related equity.
VaR Methodology, Assumptions and Limitations. The modeling
of the risk characteristics of our trading positions involves a number of
assumptions and approximations. While management believes that these assumptions
and approximations are reasonable, there is no uniform industry methodology for
estimating VaR, and different assumptions and/or approximations could produce
materially different VaR estimates.
We use historical data to estimate our VaR and, to better reflect asset
volatilities and correlations, these historical data are weighted to give
greater importance to more recent observations. Given its reliance on historical
data, VaR is most effective in estimating risk exposures in markets in which
there are no sudden fundamental changes or shifts in market conditions. An
inherent limitation of VaR is that past changes in market risk factors, even
when weighted toward more recent observations, may not produce accurate
predictions of future market risk. For example, the asset volatilities to which
we were exposed in the second half of 1998 were substantially larger than those
reflected in the historical data used during that time period to estimate our
VaR. Moreover, VaR calculated for a one-day time horizon does not fully capture
the market risk of positions that cannot be liquidated or offset with hedges
within one day.
VaR also should be evaluated in light of the methodology's other
limitations. For example, when calculating the VaR numbers shown below, we
assume that asset returns are normally distributed. Non-linear risk exposures on
options and the potentially mitigating impact of intra-day changes in related
hedges would likely produce non-normal asset returns. Different distributional
assumptions could produce a materially different VaR.
The following table sets forth our daily VaR for substantially all of
our trading positions:
(in millions)
| Risk Categories |
As of November
1998 |
|---|---|
| Interest rates | $ 27.3 |
| Currency rates | 9.0 |
| Equity prices | 25.3 |
| Commodity prices | 7.0 |
| Diversification effect(1) | (25.7) |
| Firmwide | $ 42.9 |
(1) Equals the difference between firmwide daily VaR and the sum of the
daily VaRs for the four risk categories. This effect arises because
the four market risk categories are not perfectly correlated.
The daily VaR for substantially all of our trading positions as of
February 1999 was not materially different from our daily VaR as of November
1998.
For a discussion of what our daily VaR would have been as of November
1998 had we used our volatility and correlation data as of May 29, 1998, see
"Business — Trading and Principal Investments — Trading Risk
Management — Risk Reduction".
Non-Trading Risk
The market risk associated with our non-trading financial instruments,
including investments in our merchant banking funds, is measured using a
sensitivity analysis that estimates the potential reduction in our net revenues
associated with hypothetical market movements. As of February 1999 and November
1998, non-trading market risk was not material.
Recent Enhancements to Risk Management
While VaR continues to be a core tool in our risk management process, management has increased its emphasis on the supplemental measures described below:
- Credit Spread Limits. In addition to VaR, the Firmwide Risk
Committee now sets market risk limits based on a scenario analysis of
widening credit spreads similar to those experienced in the second half
of 1998; and
- Scenario Analyses. Management is using scenario analyses that
reflect more extreme market conditions, such as large increases in
market volatility as well as substantial and sustained adverse movements
in the volatility and correlation of our relative value positions.
Valuation of Trading Inventory
Substantially all of our inventory positions are marked-to-market on a
daily basis and changes are recorded in net revenues. The individual business
units are responsible for pricing the positions they manage. The Controllers
Department, in conjunction with the Firmwide Risk Department, regularly performs
pricing reviews.
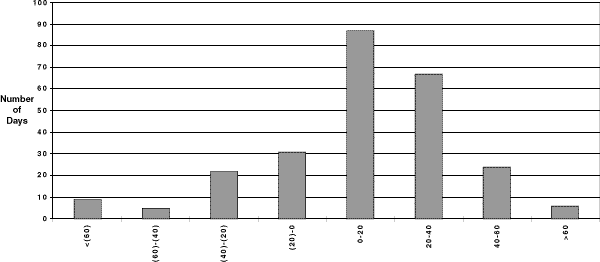
Trading Net Revenues Distribution
The following chart sets forth the frequency distribution for
substantially all of our daily trading net revenues for the year ended November
1998:
Credit Risk
Credit risk represents the loss that we would incur if a counterparty
or issuer of securities or other instruments we hold fails to perform its
contractual obligations to us. To reduce our credit exposures, we seek to enter
into netting agreements with counterparties that permit us to offset receivables
and payables with such counterparties. We do not take into account any such
agreements when calculating credit risk, however, unless management believes a
legal right of setoff exists under an enforceable master netting agreement.
For most businesses, counterparty credit limits are established by the
Credit Department, which is independent of the revenue-producing departments,
based on guidelines set by the Firmwide Risk and Credit Policy Committees. Our
global credit management systems monitor current and potential credit exposure
to individual counterparties and on an aggregate basis to counterparties and
their affiliates. The systems also provide management with information regarding
overall credit risk by product, industry sector, country and region.
Risk Limits
Business unit risk limits are established by the risk committees and
may be further segmented by the business unit managers to individual trading
desks.
Market risk limits are monitored on a daily basis by the Firmwide Risk
Department and are reviewed regularly by the appropriate risk committee. Limit
violations are reported to the appropriate risk committee and the appropriate
business unit managers.
Inventory position limits are monitored by the Controllers Department
and position limit violations are reported to the appropriate business unit
managers and the Finance Committee. When inventory position limits are used to
monitor market risk, they are also monitored by the Firmwide Risk Department and
violations are reported to the appropriate risk committee.
Derivative Contracts
Derivative contracts are financial instruments, such as futures,
forwards, swaps or option contracts, that derive their value from underlying
assets, indices, reference rates or a combination of these factors. Derivative
instruments may be entered into by Goldman Sachs in privately negotiated
contracts, which are often referred to as over-the-counter derivatives, or they
may be listed and traded on an exchange.
Most of our derivative transactions are entered into for trading
purposes. We use derivatives in our trading activities to facilitate customer
transactions, to take proprietary positions and as a means of risk management.
We also enter into non-trading derivative contracts to manage the interest rate
and currency exposure on our long-term borrowings.
Derivatives are used in many of our businesses, and we believe that the
associated market risk can only be understood relative to the underlying assets
or risks being hedged, or as part of a broader trading strategy. Accordingly,
the market risk of derivative positions is managed with all of our other
non-derivative risk.
Derivative contracts are reported on a net-by-counterparty basis on our
consolidated statements of financial condition where management believes a legal
right of setoff exists
under an enforceable master netting agreement.
For an over-the-counter derivative, our credit exposure is directly
with our counterparty and continues until the maturity or termination of such
contract.
The following table sets forth the distribution, by credit rating, of
substantially all of our exposure with respect to over-the-counter derivatives
as of November 1998, after taking into consideration the effect of netting
agreements. The categories shown reflect our internally determined public rating
agency equivalents.
| Credit Rating Equivalent |
Amount |
Percentage |
|---|---|---|
| AAA/Aaa | $ 2,170 | 12% |
| AA/Aa2 | 5,571 | 30 |
| A/A2 | 4,876 | 26 |
| BBB/Baa2 | 3,133 | 17 |
| BB/Ba2 or lower | 1,970 | 11 |
| Unrated(1) | 730 |
4 |
| $18,450 |
100% |
(1) In lieu of making an individual assessment of such counterparties'
credit, we make a determination that the collateral held in respect
of such obligations is sufficient to cover our exposure. In making
this determination, we take into account various factors, including
legal uncertainties and market volatility.
As of November 1998, we held approximately $2.97 billion in collateral
against these over-the-counter derivative exposures. This collateral consists
predominantly of cash and U.S. government and agency securities and is usually
received by us under agreements entitling us to require additional collateral
upon specified increases in exposure or the occurrence of negative credit
events.
In addition to obtaining collateral and seeking netting agreements, we
attempt to mitigate default risk on derivatives by entering into agreements that
enable us to terminate or reset the terms of transactions after specified time
periods or upon the occurrence of credit-related events, and by seeking third-party guarantees of the obligations of some counterparties.
Derivatives transactions may also involve the legal risk that they are
not authorized or appropriate for a counterparty, that documentation has not
been properly executed or that executed agreements may not be enforceable
against the counterparty. We attempt to minimize these risks by obtaining advice
of counsel on the enforceability of agreements as well as on the authority of a
counterparty to effect the derivative transaction.
Operational and Year 2000 Risks
Operational Risk. Goldman Sachs may face reputational damage,
financial loss or regulatory risk in the event of an operational failure or
error. A systems failure or failure to
enter a trade properly into our records may result in an inability to settle
transactions in a timely manner or a breach of regulatory requirements.
Settlement errors or delays may cause losses due to damages owed to
counterparties or movements in prices. These operational and systems risks may
arise in connection with our own systems or as a result of the failure of an
agent acting on our behalf.
The Global Operations Department is responsible for establishing,
maintaining and approving policies and controls with respect to the accurate
inputting and processing of transactions, clearance and settlement of
transactions, the custody of securities and other instruments and the detection
and prevention of employee errors or improper or fraudulent activities. Its
personnel work closely with the Information Technology Department in creating
systems to enable appropriate supervision and management of its policies. The
Global Operations Department is also responsible, together with other areas of
Goldman Sachs, including the Legal and Compliance Departments, for ensuring
compliance with applicable regulations with respect to the clearance and
settlement of transactions and the margining of positions. The Network
Management Department oversees our relationships with our clearance and
settlement agents, regularly reviews agents' performance and meets with these
agents to review operational issues.
Year 2000 Readiness Disclosure. Goldman Sachs has determined
that it will be required to modify or replace portions of its information
technology systems, both hardware and software, and its non-information
technology systems so that they will properly recognize and utilize dates beyond
December 31, 1999. We presently believe that with modifications to existing
software, conversions to new software and replacement of some hardware, the Year
2000 issue will be satisfactorily resolved in our own systems worldwide.
However, if such modifications and conversions are not made or are not completed
on a timely basis, the Year 2000 issue would have a material adverse effect on
Goldman Sachs. Moreover, even if these changes are successful, failure of third
parties to which we are financially or operationally linked to address their own
Year 2000 problems would also have a material adverse effect on Goldman Sachs.
For a description of the Year 2000 issue and some of the related risks,
including possible problems that could arise, see "Risk Factors — Our
Computer Systems and Those of Third Parties May Not Achieve Year 2000
Readiness — Year 2000 Readiness Disclosure".
Recognizing the broad scope and complexity of the Year 2000 problem, we
have established a Year 2000 Oversight Committee to promote awareness and ensure
the active participation of senior management. This Committee, together with
numerous sub-committees chaired by senior managers throughout Goldman Sachs and
our Global Year 2000 Project Office, is responsible for planning, managing and
monitoring our Year 2000 efforts on a global basis. Our Management Controls
Department assesses the scope and sufficiency of our Year 2000 program and
verifies that the principal aspects of our Year 2000 program are being
implemented according to plan.
Our Year 2000 plans are based on a five-phase approach, which includes
awareness; inventory, assessment and planning; remediation; testing; and
implementation. The awareness phase (in which we defined the scope and
components of the problem, our methodology and approach and obtained senior
management support and funding) was completed in September 1997. We also
completed the inventory, assessment and planning phase for our systems in
September 1997. By the end of March 1999, we completed the remediation, testing
and implementation phases for 99% of our mission-critical systems, and we plan
to complete these three phases for the remaining 1% by the end of June 1999. In
March 1999, we completed the first cycle of our internal integration testing
with respect to critical securities and transaction flows. This cycle, which
related to U.S. products, was completed successfully with no material problem.
The remaining cycle, which
will relate primarily to non-U.S. products, is to be completed in June 1999.
This testing is intended to validate that our systems can successfully perform
critical business functions beginning in January 2000. With respect to our
non-mission-critical systems, we expect to complete our Year 2000 efforts during
calendar 1999.
For technology products that are supplied by third-party vendors, we
have completed an inventory, ranked products according to their importance and
developed a strategy for achieving Year 2000 readiness for substantially all
non-compliant versions of software and hardware. While this process included
collecting information from vendors, we are not relying solely on vendors'
verifications that their products are Year 2000 compliant or ready. As of March
31, 1999, we had substantially completed testing and implementation of
vendor-supplied technology products that we consider mission-critical. With
respect to telecommunications carriers, we are relying on information provided
by these vendors as to whether they are Year 2000 compliant because these
vendors have indicated that they will not test with individual companies.
We are also addressing Year 2000 issues that may exist outside our own
technology activities, including our facilities, external service providers and
other third parties with which we interface. We have inventoried and ranked our
customers, business and trading partners, utilities, exchanges, depositories,
clearing and custodial banks and other third parties with which we have
important financial and operational relationships. We are continuing to assess
the Year 2000 preparedness of these customers, business and trading partners and
other third parties.
By the end of March 1999, we had participated in approximately 115
"external", i.e., industry-wide or point-to-point, tests with exchanges,
clearing houses and other industry utilities, as well as the "Beta" test
sponsored by the Securities Industry Association for its U.S. members in July
1998. We successfully completed all of these tests with no material problems. By
the end of June 1999, we expect to have participated in approximately 60
additional external tests, including the Securities Industry Association
"Streetwide" test scheduled to be completed in April 1999 and other major
industry tests in those global markets where we conduct significant
business.
Acknowledging that a Year 2000 failure, whether internal or external,
could have an adverse effect on the ability to conduct day-to-day business, we
are employing a comprehensive and global approach to contingency planning. Our
contingency planning objective is to identify potential system failure points
that support processes that are critical to our mission and to develop
contingency plans for those failures that may reasonably be expected to occur,
with the general goal of ensuring, to the maximum extent practical, that minimum
acceptable levels of service can be maintained by us. In the event of system
failures, our contingency plans will not guarantee that existing levels of
service will be fully maintained, especially if these failures involve external
systems or processes over which we have little or no direct control or involve
multiple failures across a variety of systems.
We anticipate that contingency plans for our core business units will
be substantially completed during June 1999, and by September 30, 1999 for the
rest of our businesses. In addition, we are developing contingency plans for
funding and balance sheet management and other related activities. We expect our
contingency plans to include establishing additional sources of liquidity that
could be drawn upon in the event of systems disruption. We are also developing a
crisis management group to guide us through the transition period. We expect to
reduce trading activity in the period leading up to January 2000 to minimize the
impact of potential Year 2000-related failures. A reduction in trading activity
by us or by other market participants in anticipation of possible Year 2000
problems could adversely affect our results of operations, as discussed under
"Risk Factors — Our
Computer Systems and Those of Third Parties May Not Achieve Year 2000
Readiness — Year 2000 Readiness Disclosure".
We have incurred and expect to continue to incur expenses allocable to
internal staff, as well as costs for outside consultants, to complete the
remediation and testing of internally developed systems and the replacement and
testing of third-party products and services, including non-technology products
and services, in order to achieve Year 2000 compliance. We currently estimate
that these costs will total approximately $150 million, a substantial majority
of which has been spent to date. These estimates include the cost of technology
personnel but do not include the cost of most non-technology personnel involved
in our Year 2000 effort. The remaining cost of our Year 2000 program is expected
to be incurred in 1999 and early 2000. The Year 2000 program costs will continue
to be funded through operating cash flow. These costs are expensed as incurred.
We do not expect that the costs associated with implementing our Year 2000
program will have a material adverse effect on our results of operations,
financial condition, liquidity or capital resources.
The costs of the Year 2000 program and the date on which we plan to
complete the Year 2000 modifications are based on current estimates, which
reflect numerous assumptions about future events, including the continued
availability of resources, the timing and effectiveness of third-party
remediation plans and other factors. We can give no assurance that these
estimates will be achieved, and actual results could differ materially from our
plans. Specific factors that might cause material differences include, but are
not limited to, the availability and cost of personnel trained in this area, the
ability to locate and correct relevant computer source codes and embedded chip
technology, the results of internal and external testing and the timeliness and
effectiveness of remediation efforts of third parties.
In order to focus attention on the Year 2000 problem, management has
deferred several technology projects that address other issues. However, we do
not believe that this deferral will have a material adverse effect on our
results of operations or financial condition.
In June 1996, the Financial Accounting Standards Board issued Statement
of Financial Accounting Standards No. 125, "Accounting for Transfers and
Servicing of Financial Assets and Extinguishments of Liabilities", effective for
transactions occurring after December 31, 1996. Statement of Financial
Accounting Standards No. 125 establishes standards for distinguishing transfers
of financial assets that are accounted for as sales from transfers that are
accounted for as secured borrowings.
The provisions of Statement of Financial Accounting Standards No. 125
relating to repurchase agreements, securities lending transactions and other
similar transactions were deferred by the provisions of Statement of Financial
Accounting Standards No. 127, "Deferral of the Effective Date of Certain
Provisions of FASB Statement No. 125", and became effective for transactions
entered into after December 31, 1997. This Statement requires that the
collateral obtained in certain types of secured lending transactions be recorded
on the balance sheet with a corresponding liability reflecting the obligation to
return such collateral to its owner. Effective January 1, 1998, we adopted the
provisions of Statement of Financial Accounting Standards No. 125 that were
deferred by Statement of Financial Accounting Standards No. 127. The adoption of
this standard increased our total assets and liabilities by $8.99 billion and
$11.64 billion as of February 1999 and November 1998, respectively.
In February 1997, the Financial Accounting Standards Board issued
Statement of Financial Accounting Standards No. 128,
"Earnings Per Share", effective for periods ending after December 15, 1997, with
restatement required for all prior periods. Statement of Financial Accounting
Standards No. 128 establishes new standards for computing and presenting
earnings per share. This Statement replaces primary and fully diluted earnings
per share with "basic earnings per share", which excludes dilution, and "diluted
earnings per share", which includes the effect of all potentially dilutive
common shares and other dilutive securities. Because we have not historically
reported earnings per share, this Statement will have no impact on our
historical financial statements. This Statement will, however, apply to our
financial statements that are prepared after the offerings. See "Pro Forma
Consolidated Financial Information" for a calculation of pro forma earnings per
share.
In June 1997, the Financial Accounting Standards Board issued Statement
of Financial Accounting Standards No. 131, "Disclosures about Segments of an
Enterprise and Related Information", effective for fiscal years beginning after
December 15, 1997, with reclassification of earlier periods required for
comparative purposes. Statement of Financial Accounting Standards No. 131
establishes the criteria for determining an operating segment and establishes
the disclosure requirements for reporting information about operating segments.
We intend to adopt this standard at the end of fiscal 1999. This Statement is
limited to issues of reporting and presentation and, therefore, will not affect
our results of operations or financial condition.
In February 1998, the Financial Accounting Standards Board issued
Statement of Financial Accounting Standards No. 132, "Employers' Disclosures
about Pensions and Other Postretirement Benefits", effective for fiscal years
beginning after December 15, 1997, with restatement of disclosures for earlier
periods required for comparative purposes. Statement of Financial Accounting
Standards No. 132 revises certain employers' disclosures about pension and other
post-retirement benefit plans. We intend to adopt this standard at the end of
fiscal 1999. This Statement is limited to issues of reporting and presentation
and, therefore, will not affect our results of operations or financial
condition.
In March 1998, the Accounting Standards Executive Committee of the
American Institute of Certified Public Accountants issued Statement of Position
No. 98-1, "Accounting for the Costs of Computer Software Developed or Obtained
for Internal Use", effective for fiscal years beginning after December 15, 1998.
Statement of Position No. 98-1 requires that certain costs of computer software
developed or obtained for internal use be capitalized and amortized over the
useful life of the related software. We currently expense the cost of all
software development in the period in which it is incurred. We intend to adopt
this Statement in fiscal 2000 and are currently assessing its effect.
In June 1998, the Financial Accounting Standards Board issued Statement of Financial Accounting Standards No. 133, "Accounting for Derivative Instruments and Hedging Activities", effective for fiscal years beginning after June 15, 1999. Statement of Financial Accounting Standards No. 133 establishes accounting and reporting standards for derivative instruments, including certain derivative instruments embedded in other contracts (collectively referred to as derivatives), and for hedging activities. This Statement requires that an entity recognize all derivatives as either assets or liabilities in the statement of financial condition and measure those instruments at fair value. The accounting for changes in the fair value of a derivative instrument depends on its intended use and the resulting designation. We intend to adopt this standard in fiscal 2000 and are currently assessing its effect.
| Previous page | Return to table of contents | Next page |